How to add intelligence to Nagios through alert correlation, part 2

The only proof point most Ops pros need to validate this is their own inboxes and mobile phones. If you’ve ever had your phone vibrate off the table because of an alert flood, you know what I mean. Even more frustrating is when those alerts turn out to be nothing more than noise.
What Nagios needs is an additional layer of intelligence to help it sort out the real alerts from the background noise.
Of course, this is easier said than done.
In a previous post, we discussed why Nagios generates so many alerts in the first place, and why so few of them are actually actionable.
Now, let’s discuss what to do about it.
Alert Correlation to the Rescue
The single best way to modernize monitoring and alerting is through alert correlation. If hundreds of thousands of alerts potentially point to one root problem, as is often the case, then we need to find a way to correlate those alerts so we can see – in an instant – what the real problem is.
The best way to understand how alert correlation improves infrastructure monitoring is to look at an example.
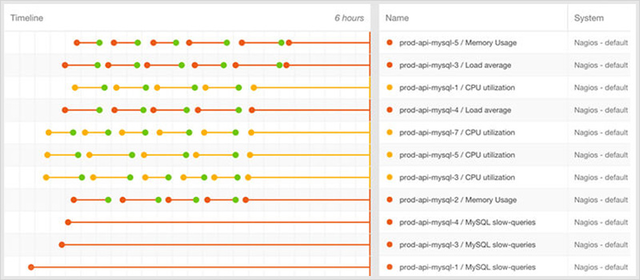
Consider a MySQL cluster with 25 hosts. Some of these hosts have been experiencing high page-fault rates, while a few others just sent out alerts about low free memory. In 30 minutes, we have received more than 20 individual alerts. Your Nagios dashboard now looks like a circus. Your email inbox looks like every spammer in the world is getting past your filters. And if you’re away from the office, your mobile phone is buzzing a hole in your pocket.
There is a right way and a wrong way to look at these alerts. The wrong way, obviously, is to look at all of these alerts as separate and equal. Big mistake.
Instead, we should first regard these alerts as representative of a single incident. When an alert flood comes in, unless there is evidence to the contrary, we should first search for the prime mover.
Viewed through a dashboard that features alert correlation, this stream of alerts would be grouped together. All of the cluster’s memory and page-fault alerts would be aggregated, pointing to the real root cause and allowing us to stay in control – even during the alert flood.
Furthermore, by correlating these alerts together, we can easily distinguish between alerts belonging to root incident versus other similar but unrelated alerts, such as storage issues on the MySQL nodes, or a global connectivity issue experienced by the datacenter. In an alert flood, these other alerts are often drowned out.
Alert correlation is a method of grouping highly-related alerts into one high-level incident. To do this, it addresses three main parameters:
-
Topology: the host or host group that emits the alerts
-
Time: the time difference between the alerts
-
Context: the check types of the alerts
Why Alert Filtering Isn’t Enough
Are there other ways to combat alert floods? Sure, but they are lacking.
One DIY method commonly attempted by companies is alert filtering. Monitoring engineers define custom dashboards limited to a small set of alerts, designated as high-severity or sev-1 alerts. Such a dashboard is expected to be considerably less noisy than a full dashboard.
However, there are three major problems with alert filtering. First, it introduces a blind spot into your operational visibility. Often, low-severity alerts are precursors to high-severity alerts. For instance, a CPU load issue might quickly evolve into a full outage.
By ignoring the low-severity issues, you force yourself into a reactive mode. The goal with alerting is to proactively resolve problems before they spiral out of control. However, alert filtering often does the exact opposite. Because low-severity issues are actively dismissed, teams risk reacting to alerts only after the underlying problem has already impacted production.
The second problem with filtering is that filtered dashboards become very noisy very quickly. Take the MySQL example above; let’s say you want to see all of the page-fault rate alerts in your high-severity dashboard. So, even after eliminating the low-memory alerts, you are still stuck with thirteen alerts in your new dashboard.
Finally, the third major problem is this sort of filtering only targets known problems. If a new risk comes along – let’s say a new type of zero-day DDoS attack – those filters could be sidestepped entirely.
The Inevitability of Alert Correlation
By contrast, alert correlation allows you to avoid alert floods without losing visibility. Once a company adopts alert correlation, it won’t need a high-severity dashboard anymore.
At BigPanda, we developed a modern alert correlation platform that was built for modern, cloud-based, distributed infrastructures. And better yet, we optimized it for Nagios.
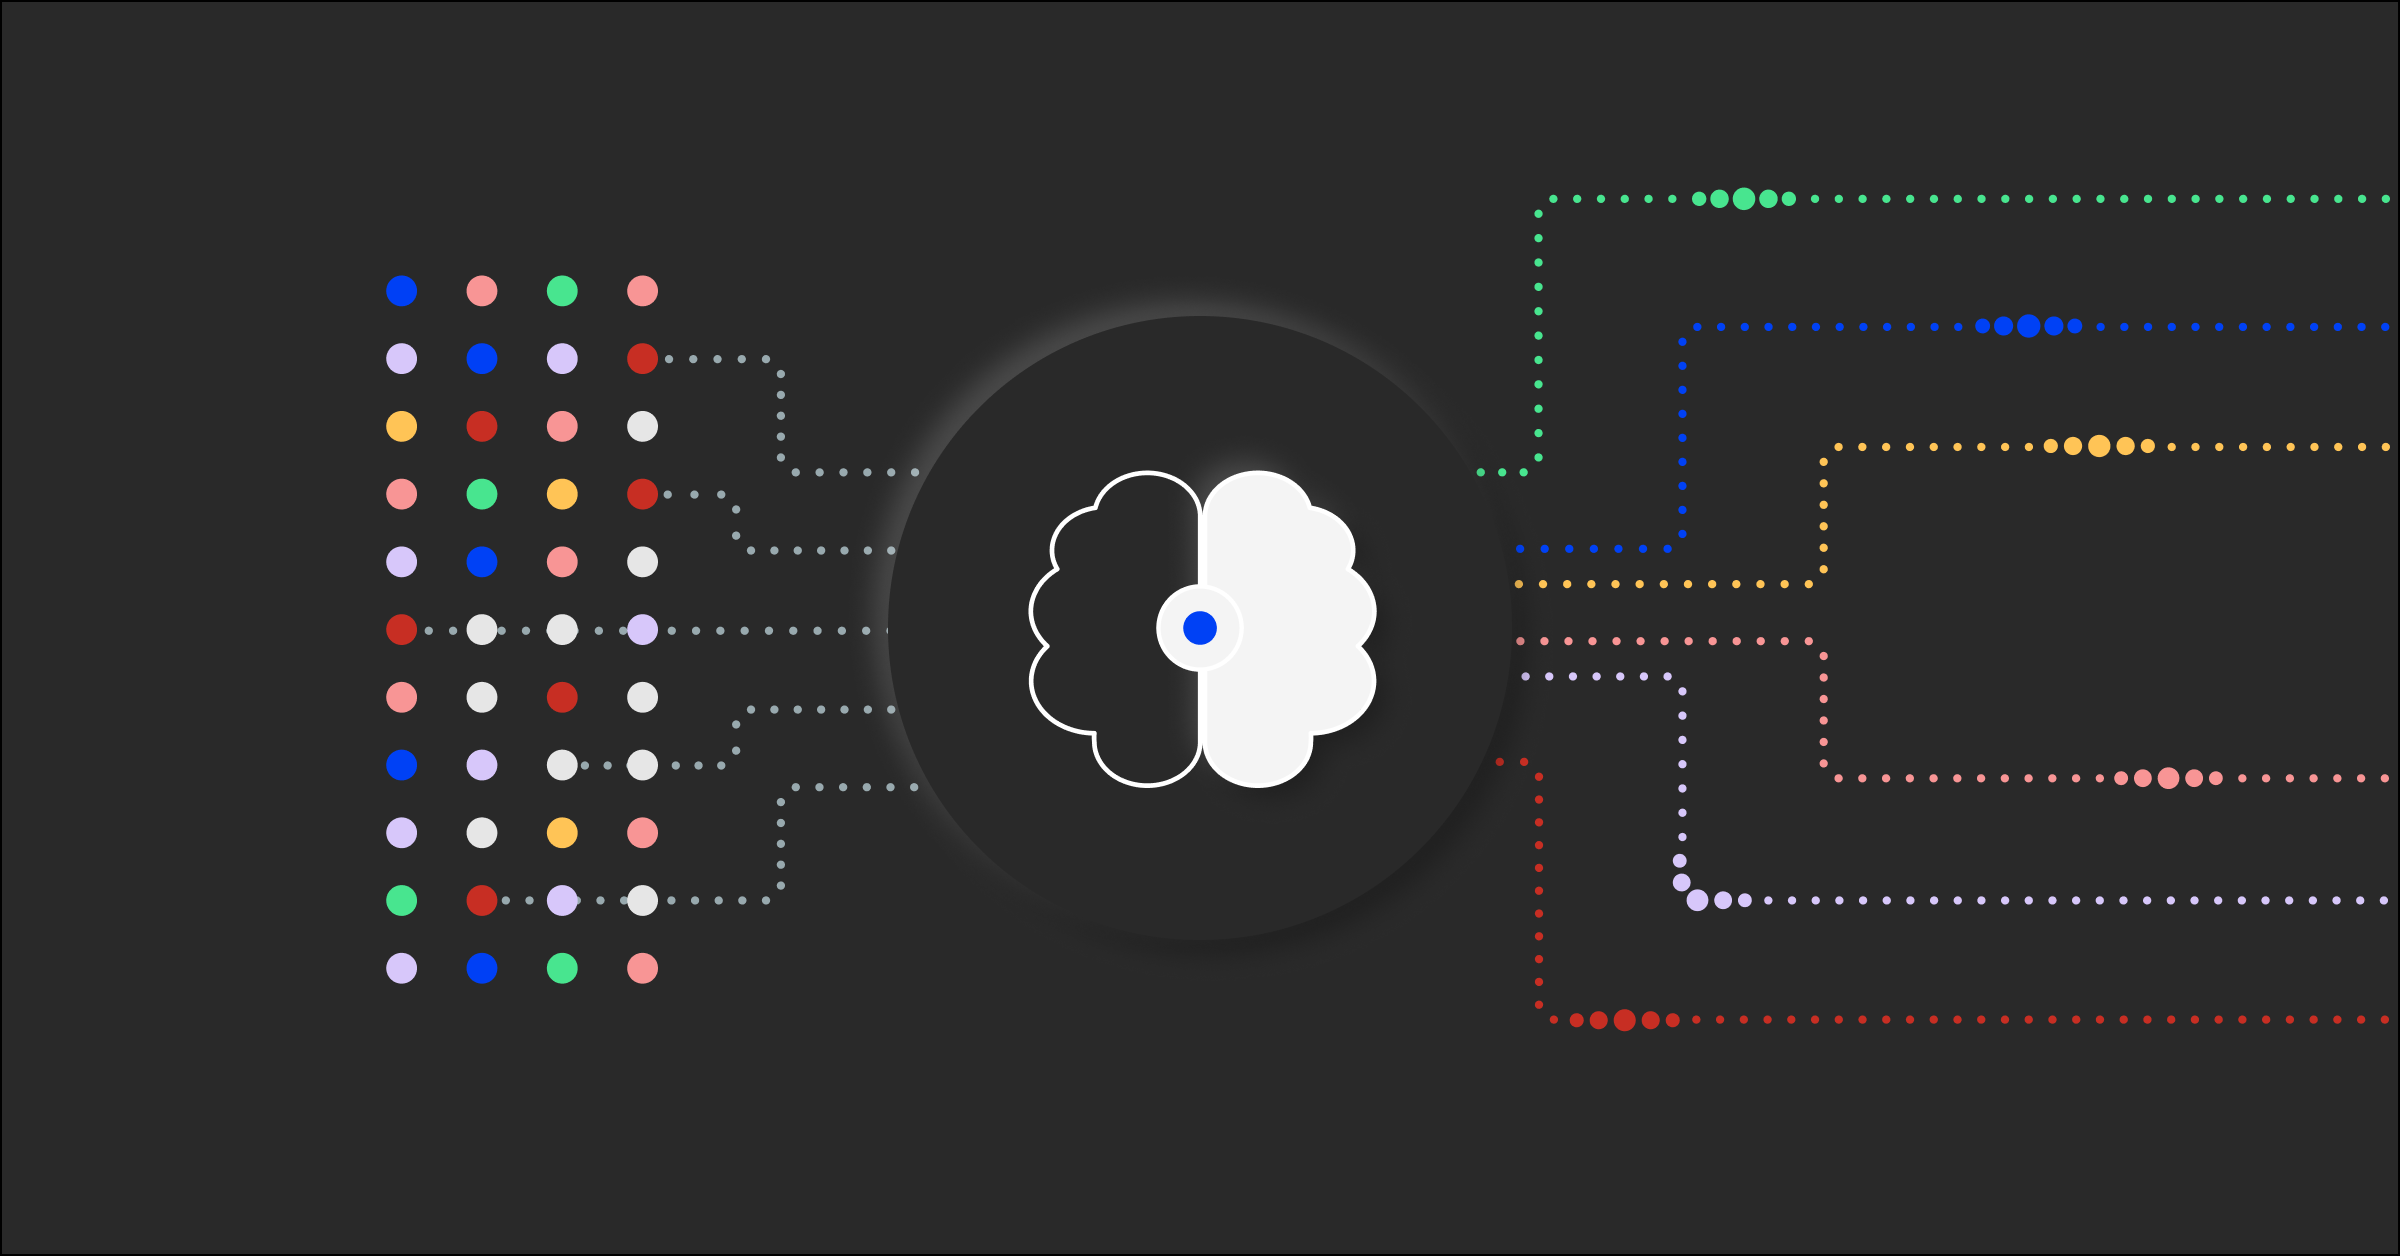
BigPanda consumes your Nagios alerts in real time and uses an intelligent algorithm to process and correlate these alerts. The BigPanda dashboard is a cloud-based application that presents all of your Nagios alerts grouped together into high-level incidents.
Among the benefits of using BigPanda are:
- Efficiency. BigPanda’s algorithm is capable of reducing up to 99% of your alert load, while remaining highly accurate.
- Custom Rules Capabilities. BigPanda allows you to configure custom rules for special correlation use cases.
- Full-Stack Correlation. In addition to Nagios, BigPanda can also consume alerts from other monitoring tools, such as New Relic, Splunk, Pingdom, and many others.
But don’t take our word for it. Try BigPanda yourself, with no obligation whatsoever, and learn how much easier life can be with correlation helping you make sense of your endless stream of alerts.
